

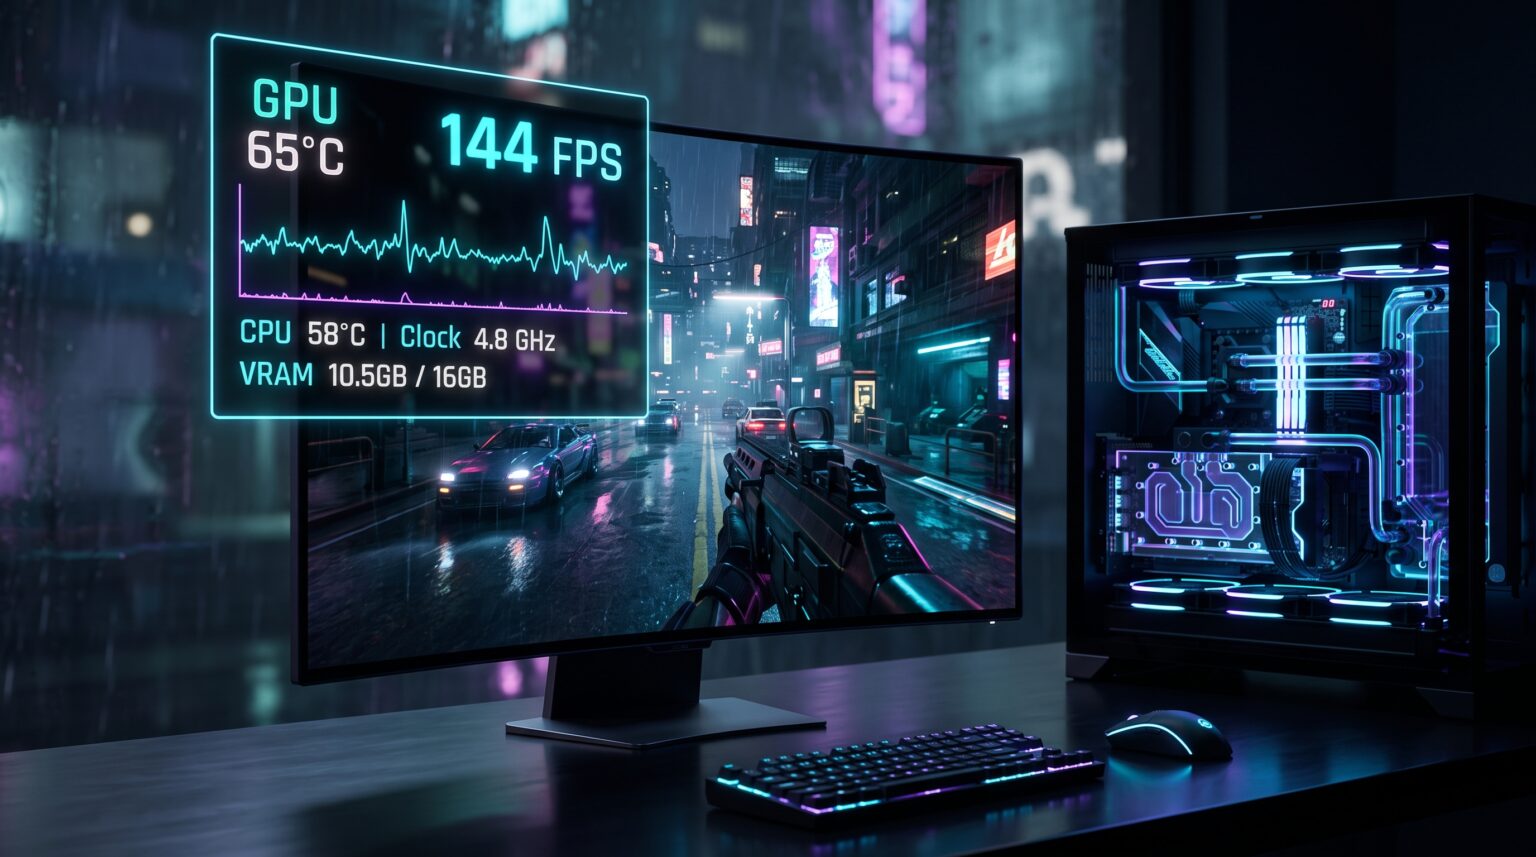
Proper MSI Afterburner setup in conjunction with RivaTuner Statistics Server (RTSS) transforms the utility into a reliable tool for in-depth PC diagnostics and in-game system monitoring.
The program allows real-time tracking of frame rate, GPU and CPU temperatures, power consumption, memory usage, and analysis of the frametime graph to identify micro-stutters.
In this step-by-step guide, we’ll configure an informative overlay for your games, eliminate potential crashes, and cover basic graphics card optimization.
1. Clean Installation of the Bundle: Afterburner and RTSS
For telemetry to work correctly, it’s crucial to install both software modules:
-
Download the program distribution package exclusively from the official developer website (msi.com or guru3d.com), avoiding unverified mirrors.
-
During installation, the installer will offer an additional component — RivaTuner Statistics Server. Make sure to keep the checkbox active. RTSS is responsible for rendering graphics over the video stream in games using DirectX, Vulkan, and OpenGL.
-
Run the program as an administrator. In the main window, go to “Settings” (gear icon).
-
On the “General” tab, activate the checkboxes:
-
Start with Windows
-
Start minimized
-
2. On-Screen Display (OSD) Setup: Displaying Metrics
Go to the “Monitoring” tab in Afterburner settings. Here you’ll find a list of all system sensors.
To make a parameter appear on screen during gameplay, select it with a click and check the box next to “Show in OSD” (On-Screen Display) at the bottom of the window.
Optimal sensor set for informative balance without cluttering the screen:
-
GPU Temperature — graphics chip safety.
-
GPU Usage — monitoring for GPU bottleneck (normally 95–99%).
-
GPU Core Clock and Memory Clock — detecting frequency drops during throttling.
-
GPU Memory Usage (VRAM) — shows video memory filled with textures.
-
CPU Temperature — monitoring processor cooling.
-
CPU Usage — identifying insufficient CPU threads.
-
RAM Usage — tracking RAM leaks.
-
Frame Rate (FPS) — average smoothness indicator.
-
Frametime — switch the graph type to “graph” to see individual frame drops and delays.
Helpful tip: For each sensor, you can set a short, clear name in the “Rename sensor” field: for example, instead of a long string, simply enter “RTX 4060” or “Ryzen 5”.
3. Customizing Appearance via RivaTuner (RTSS)
After configuring the sensor list, go to the Windows background icons (system tray) and click on the blue monitor icon — this is the RTSS panel:
-
On-Screen Display Support: the switch should be in the ON position.
-
Framerate limit: here you can strictly limit the frame rate to your monitor’s refresh rate (e.g., 140 FPS for 144 Hz), which significantly reduces input lag and eliminates screen tearing when G-Sync / FreeSync is enabled.
-
On-Screen Display zoom: this slider adjusts the physical font size of the telemetry on screen.
-
Raster 3D / Vector 3D: choose a suitable font style and background color so that the numbers don’t blend with bright areas of the game.
4. Basic Graphics Card Undervolting Without Hardware Risk
In addition to passive monitoring, MSI Afterburner allows you to normalize the temperature regime of NVIDIA GeForce and AMD Radeon graphics cards using the frequency/voltage curve (Curve Editor):
-
In the main utility window, press the key combination Ctrl + F.
-
A coordinate grid of voltages (mV) and clock frequency (MHz) will open.
-
Reducing the voltage by 50–70 mV while maintaining the base factory frequency lowers the adapter’s power consumption by 15–25% and drops the temperature sensor by 5 to 8 degrees without performance loss.
-
Save the finished preset to a profile (floppy disk icon in the bottom right) and enable auto-start with the system.
5. What to Do If Monitoring Doesn’t Show Up In-Game?
If the game is running but the overlay doesn’t appear, follow these steps:
-
Overlay conflict: disable background overlays from third-party utilities (Discord, GeForce Experience, Steam Overlay).
-
Anti-cheat protection: in the RTSS panel, switch the Application detection level from Low to Medium or High.
-
Game display mode: switch the game from “Windowed Fullscreen” to “Exclusive Fullscreen” or vice versa.
For homelabs, remote testing, and staging environments, we run NVMe VDS instances on Erahost. Fast provisioning, European routing, and predictable I/O.
View NVMe Plans →